Grid processing: geometry, mask, query, regridding
This notebook shows how to use some extra features for your gridmarthe treatments
# import modules
import numpy as np
import gridmarthe as gm
import matplotlib.pyplot as plt
from matplotlib.colors import LogNorm
# load data for example
grid = gm.load_marthe_grid('./data/craie_npc.permh', drop_nan=True)  # NaN needs to be drop or set (change 0 to nan for permh for example)
grid
<xarray.Dataset> Size: 9MB
Dimensions:  (time: 1, zone: 216742)
Coordinates:
  * time     (time) int64 8B 0
  * zone     (zone) int32 867kB 915 916 917 1300 ... 1111740 1111741 1111742
Data variables:
    permeab  (time, zone) float64 2MB 0.0001 0.0001 0.0001 ... 1.5e-05 1.5e-05
    z        (zone) int64 2MB 1 1 1 1 1 1 1 1 1 1 ... 10 10 10 10 10 10 10 10 10
    x        (zone) float32 867kB 6.138e+05 6.142e+05 ... 6.818e+05 6.822e+05
    y        (zone) float32 867kB 2.677e+06 2.677e+06 ... 2.61e+06 2.61e+06
    dx       (zone) float32 867kB 500.0 500.0 500.0 500.0 ... 500.0 500.0 500.0
    dy       (zone) float32 867kB 500.0 500.0 500.0 500.0 ... 500.0 500.0 500.0
    izone    (zone) int32 867kB 1 2 3 4 5 ... 216738 216739 216740 216741 216742
Attributes: (12/15)
    conventions:          CF-1.10
    title:
    marthe_grid_version:  9.0
    original_dimensions:  x,y,z [grids]: 387 304 10
    crs:                  {'crs_wkt': 'PROJCRS["NTF (Paris) / Lambert zone II...
    lon_resolution:       500.0
    ...                   ...
    nested_grid:          False
    extend:               xymin : 543750.0 2526350.0; xymax: 736750.0 2677850.0
    creation_date:        Created on 2026-07-16T16:29:14Z UTC
    comment:              Hydrogeological model created with MARTHE code (Thi...
    domain:               FR-France
institution: BRGM, French Geological Survey, Orléans, FranceQuery grid
gridmarthe load data as a spatially reduced grid (spatial dimension is reduced to 1D).
Hence, x and y coordinates are stored as variables, attached to grid indices, and not
as dimensions. It is then not possible to query the grid with x and y coordinates
and xarray.Dataset.sel() method.
To query the grid with x and y coordinates, one can use the :py:func:gridmarthe.assign_coords
function to set coordinates as dimension, or use the custom function :py:func:gridmarthe.sel_by_coords
to query the grid with x and y coordinates directly on 1D spatial array.
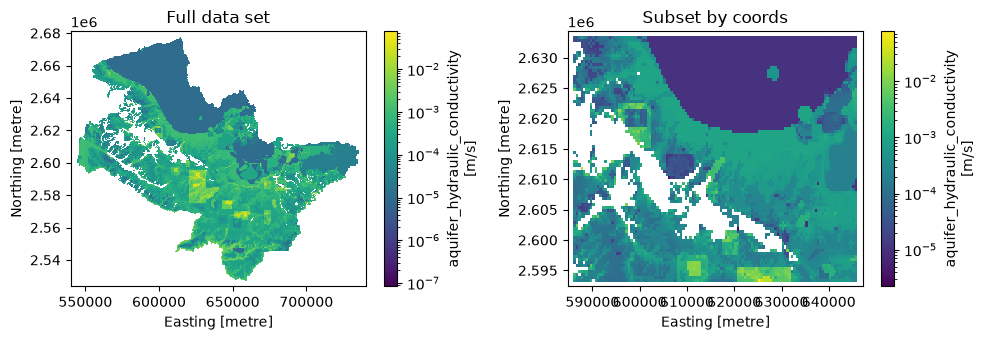
subset = gm.sel_by_coords(grid, x=(586000, 646000), y=(2593100, 2633600))
subset
<xarray.Dataset> Size: 2MB
Dimensions:  (time: 1, zone: 46342)
Coordinates:
  * time     (time) int64 8B 0
  * zone     (zone) int32 185kB 34630 34631 34632 ... 1104316 1104702 1104703
Data variables:
    permeab  (time, zone) float64 371kB 1e-05 1e-05 1e-05 ... 5e-07 5e-07 5e-07
    z        (zone) int64 371kB 1 1 1 1 1 1 1 1 1 ... 10 10 10 10 10 10 10 10 10
    x        (zone) float32 185kB 6.368e+05 6.372e+05 ... 6.452e+05 6.458e+05
    y        (zone) float32 185kB 2.633e+06 2.633e+06 ... 2.619e+06 2.619e+06
    dx       (zone) float32 185kB 500.0 500.0 500.0 500.0 ... 500.0 500.0 500.0
    dy       (zone) float32 185kB 500.0 500.0 500.0 500.0 ... 500.0 500.0 500.0
    izone    (zone) int32 185kB 2823 2824 2825 2826 ... 216026 216069 216070
Attributes: (12/15)
    conventions:          CF-1.10
    title:
    marthe_grid_version:  9.0
    original_dimensions:  x,y,z [grids]: 387 304 10
    crs:                  {'crs_wkt': 'PROJCRS["NTF (Paris) / Lambert zone II...
    lon_resolution:       500.0
    ...                   ...
    nested_grid:          False
    extend:               xymin : 543750.0 2526350.0; xymax: 736750.0 2677850.0
    creation_date:        Created on 2026-07-16T16:29:14Z UTC
    comment:              Hydrogeological model created with MARTHE code (Thi...
    domain:               FR-France
institution: BRGM, French Geological Survey, Orléans, Francefig, ax = plt.subplots(ncols=2, figsize=(10, 3.5))
gm.plot_nested_grid(gm.assign_coords(grid).sel(z=6).squeeze('time'), ax=ax[0], norm=LogNorm())
gm.plot_nested_grid(gm.assign_coords(subset).sel(z=6).squeeze('time'), ax=ax[1], norm=LogNorm())
ax[0].set_title('Full data set')
ax[1].set_title('Subset by coords')
fig.tight_layout()
For convenience and interoperability with other tools, user can also search
for the zone index of a particular cell point, using either x, y coordinates
or the i (column) and j (row) indices (:py:func:gridmarthe.search_zone).
ds = gm.load_marthe_grid("data/chasim_hallue.out", add_col_row=True).isel(time=0)
# search with column/row indices:
idx = gm.search_zone(ds, i=23, j=32)
print(idx)
<xarray.Dataset> Size: 52B
Dimensions:  (zone: 1)
Coordinates:
  * zone     (zone) int32 4B 1666
    time     int64 8B 0
Data variables:
    charge   (zone) float64 8B 44.08
    col      (zone) float64 8B 23.0
    row      (zone) float64 8B 32.0
    x        (zone) float32 4B 607.8
    y        (zone) float32 4B 2.553e+03
    dx       (zone) float32 4B 0.5
    dy       (zone) float32 4B 0.5
Attributes: (12/15)
    conventions:          CF-1.10
    title:                Modélisation du bassin de la SOMME Nappe_Libre
    marthe_grid_version:  9.0
    original_dimensions:  x,y,z [grids]: 53 54 1
    crs:                  {'crs_wkt': 'PROJCRS["NTF (Paris) / Lambert zone II...
    lon_resolution:       0.5
    ...                   ...
    nested_grid:          False
    extend:               xymin : 596.75 2542.25; xymax: 622.75 2568.75
    creation_date:        Created on 2026-07-16T16:29:15Z UTC
    comment:              Hydrogeological model created with MARTHE code (Thi...
    domain:               FR-France
    institution:          BRGM, French Geological Survey, Orléans, France
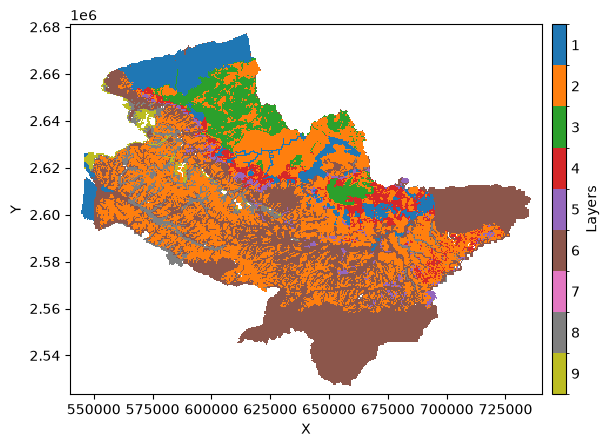
Get surface mask
See :py:func:gridmarthe.get_surface_layer for more details.
surf = gm.get_surface_layer(grid)
surf
<xarray.Dataset> Size: 3MB
Dimensions:  (zone: 53501)
Coordinates:
  * zone     (zone) int32 214kB 59988 59601 59214 58827 ... 643191 643966 643579
Data variables:
    time     (zone) int64 428kB 0 0 0 0 0 0 0 0 0 0 0 ... 0 0 0 0 0 0 0 0 0 0 0
    permeab  (zone) float64 428kB 1e-05 1e-05 1e-05 1e-05 ... 3e-05 3e-05 3e-05
    z        (zone) int64 428kB 1 1 1 1 1 1 1 1 1 1 1 ... 6 6 6 6 6 6 6 6 6 6 6
    x        (zone) float32 214kB 5.448e+05 5.448e+05 ... 7.358e+05 7.358e+05
    y        (zone) float32 214kB 2.6e+06 2.601e+06 ... 2.606e+06 2.607e+06
    dx       (zone) float32 214kB 500.0 500.0 500.0 500.0 ... 500.0 500.0 500.0
    dy       (zone) float32 214kB 500.0 500.0 500.0 500.0 ... 500.0 500.0 500.0
izone (zone) int32 214kB 4584 4523 4464 4409 ... 86862 86507 87201 86863# xarray version
toto = gm.assign_coords(surf, add_lay=False) # add lay false because it needs to be a variable to plot, not a dimension
gm.plot_outcrop(toto)
plt.show()
This function also allow user to get the value of a variable in the surface layer, or a subset of aquifer layers.
For example, to get the value of your variable (groundwater head for example) in the first layer encountered between 3 layers:
head_surf = gm.get_surface_layer(grid, aquif_layers=[6,8,9]) # get the values in the first layer between layers 6, 8 and 9
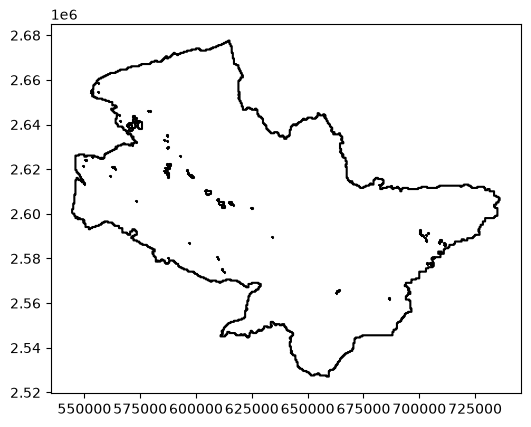
Get mask of active domain
See :py:func:gridmarthe.get_active_mask
mask = gm.get_active_mask(grid) # return a geopandas geodataframe
mask.boundary.plot(color='k')
plt.show()
Compute depths and thickness
Users can get geometry attributes (depth, thickness, upper/lower altitudes) in a dataset:
See compute_geometry() for more details.
topo = gm.load_marthe_grid('./data/example.topog')   # be careful with nan here, topography can be set outside of active area
hsubs = gm.load_marthe_grid('./data/example.hsubs')  # same here, hsubs can be set outside of active area
geom = gm.compute_geometry(topo, hsubs)
# print(geom.where(~geom['depth'].isnull(), drop=True))
geom
<xarray.Dataset> Size: 80MB
Dimensions:    (zone: 1176480)
Coordinates:
  * zone       (zone) int32 5MB 1 2 3 4 5 ... 1176477 1176478 1176479 1176480
Data variables:
    h_topogr   (zone) float64 9MB 9.999e+03 9.999e+03 ... 9.999e+03 9.999e+03
    z          (zone) int64 9MB 1 1 1 1 1 1 1 1 1 ... 10 10 10 10 10 10 10 10 10
    x          (zone) float32 5MB 5.438e+05 5.442e+05 ... 7.362e+05 7.368e+05
    y          (zone) float32 5MB 2.678e+06 2.678e+06 ... 2.526e+06 2.526e+06
    dx         (zone) float32 5MB 500.0 500.0 500.0 500.0 ... 500.0 500.0 500.0
    dy         (zone) float32 5MB 500.0 500.0 500.0 500.0 ... 500.0 500.0 500.0
    z_lower    (zone) float64 9MB nan nan nan nan nan ... nan nan nan nan nan
    z_upper    (zone) float64 9MB nan nan nan nan nan ... nan nan nan nan nan
    thickness  (zone) float64 9MB nan nan nan nan nan ... nan nan nan nan nan
    depth      (zone) float64 9MB nan nan nan nan nan ... nan nan nan nan nan
Attributes: (12/15)
    conventions:          CF-1.10
    title:
    marthe_grid_version:  9.0
    original_dimensions:  x,y,z [grids]: 387 304 10
    crs:                  {'crs_wkt': 'PROJCRS["NTF (Paris) / Lambert zone II...
    lon_resolution:       500.0
    ...                   ...
    nested_grid:          False
    extend:               xymin : 543750.0 2526350.0; xymax: 736750.0 2677850.0
    creation_date:        Created on 2026-07-16T16:29:24Z UTC
    comment:              Hydrogeological model created with MARTHE code (Thi...
    domain:               FR-France
institution: BRGM, French Geological Survey, Orléans, FranceInterpolation, regridding, transformations
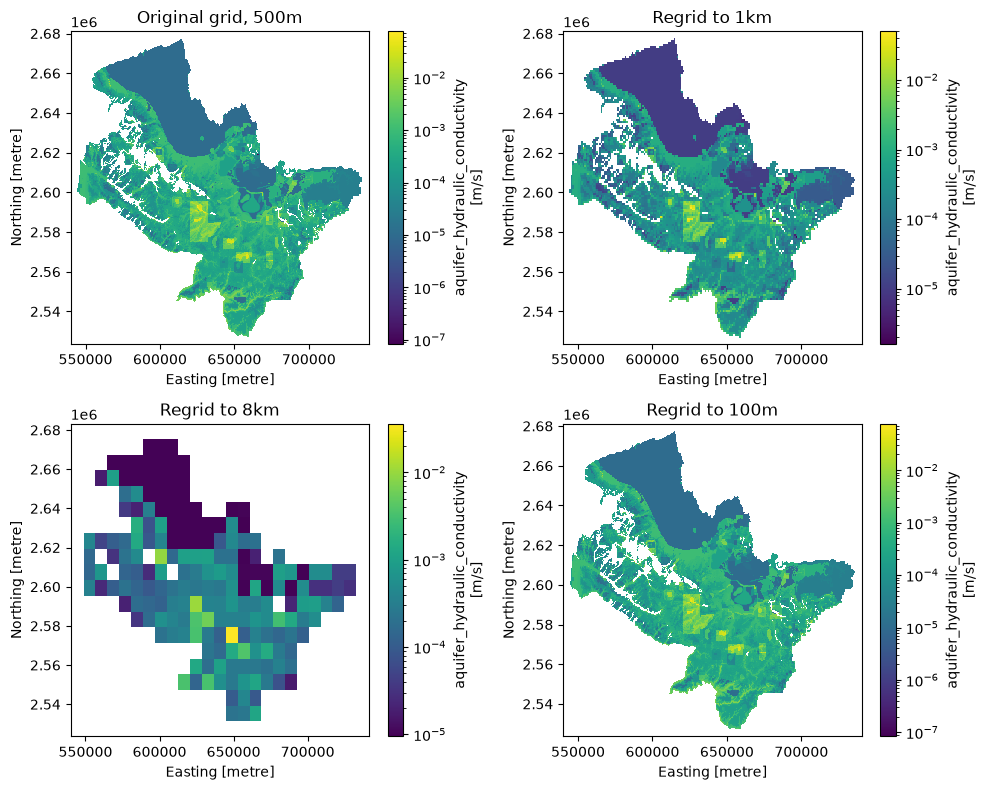
Regrid (coarse/refine resolution)
Utils function to coarse/refine grid resolution are provided, wrapping
xarray.DataArray.interp method.
By default, a linear interpolation is used.
See docs.xarray.dev/interpolation for more details
ds_coarse = gm.rescale_grid(grid, res=1e3)  # kwargs can be passed to interp method
ds_8km = gm.rescale_grid(grid, res=8e3)
ds_100m = gm.rescale_grid(grid, res=1e2)
fig, ax = plt.subplots(ncols=2, nrows=2, figsize=(10,8))
gm.plot_nested_grid(grid, ax=ax[0,0], norm=LogNorm(), itime=0, layer=6)
gm.plot_nested_grid(ds_coarse, ax=ax[0,1], norm=LogNorm(), itime=0, layer=6)
gm.plot_nested_grid(ds_8km, ax=ax[1,0], norm=LogNorm(), itime=0, layer=6)
gm.plot_nested_grid(ds_100m, ax=ax[1,1], norm=LogNorm(), itime=0, layer=6)
ax[0,0].set_title('Original grid, 500m')
ax[0,1].set_title('Regrid to 1km')
ax[1,0].set_title('Regrid to 8km')
ax[1,1].set_title('Regrid to 100m')
fig.tight_layout()
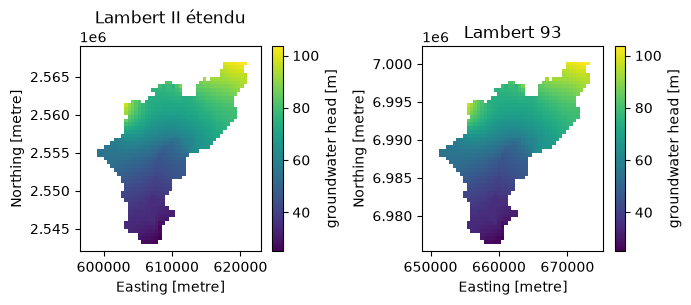
Projection transformation
Warning: this function is still experimental and only works for regular grids, read without dropping NaNs and invalid data (a full x, y, dx, dy grid is required).
ds_l2e = gm.load_marthe_grid('data/chasim_hallue.out', xyfactor=1e3).isel(time=0)
ds_l93 = gm.reproj_grid(ds_l2e, from_epsg='EPSG:27572', to_epsg='EPSG:2154', decimals=0)
fig, ax = plt.subplots(ncols=2, figsize=(7, 3))
gm.assign_coords(ds_l2e)['charge'].where(lambda x: x < 9999.).plot.pcolormesh(ax=ax[0])
gm.assign_coords(ds_l93)['charge'].where(lambda x: x < 9999.).plot.pcolormesh(ax=ax[1])
fig.tight_layout()
ax[0].set_title('Lambert II étendu')
ax[1].set_title('Lambert 93')
plt.show()