Example of treatments available
This notebook shows how to use some extra features for your gridmarthe treatments
# import modules
import numpy as np
import gridmarthe as gm
import matplotlib.pyplot as plt
grid = gm.load_marthe_grid('./data/craie_npc_gig.permh', drop_nan=True)  # NaN needs to be drop or set (change 0 to nan for permh for example)
grid
<xarray.Dataset> Size: 4MB
Dimensions:  (time: 1, zone: 101209)
Coordinates:
  * time     (time) datetime64[ns] 8B 1850-01-01
  * zone     (zone) int32 405kB 47402 47403 47763 ... 2381150 2381151 2381457
Data variables:
    permeab  (time, zone) float64 810kB 1e-05 1e-05 1e-05 ... 0.0001 0.0001
    x        (zone) float32 405kB 6.372e+05 6.378e+05 ... 6.382e+05 6.38e+05
    y        (zone) float32 405kB 2.617e+06 2.617e+06 ... 2.592e+06 2.592e+06
    dx       (zone) float32 405kB 500.0 500.0 500.0 500.0 ... 100.0 100.0 100.0
    dy       (zone) float32 405kB 500.0 500.0 500.0 500.0 ... 100.0 100.0 100.0
    z        (zone) int64 810kB 1 1 1 1 1 1 1 1 1 1 1 ... 9 9 9 9 9 9 9 9 9 9 9
    izone    (zone) int32 405kB 1 2 3 4 5 ... 101205 101206 101207 101208 101209
Attributes: (12/17)
    conventions:          CF-1.10
    title:
    marthe_grid_version:  9.0
    original_dimensions:  x,y,z [grids]: 387 304 10; 307 442 10
    crs:                  {'crs_wkt': 'PROJCRS["NTF (Paris) / Lambert zone II...
    lon_resolution:       100.0, 500.0
    ...                   ...
    period:               1850-1850
    frequency:            nan day(s)
    creation_date:        Created on 2025-12-09T16:23:56Z UTC
    comment:              Hydrogeological model created with MARTHE code (Thi...
    domain:               FR-France
institution: BRGM, French Geological Survey, Orléans, FranceGet surface mask
surf = gm.get_surface_layer(grid)
surf
<xarray.Dataset> Size: 1MB
Dimensions:  (zone: 21025)
Coordinates:
  * zone     (zone) int32 84kB 178171 177784 647989 ... 1389346 1660427 1660120
Data variables:
    time     (zone) datetime64[ns] 168kB 1850-01-01 1850-01-01 ... 1850-01-01
    permeab  (zone) float64 168kB 1e-06 1e-06 0.003068 ... 1e-06 2e-05 2e-05
    x        (zone) float32 84kB 6.188e+05 6.188e+05 ... 6.494e+05 6.494e+05
    y        (zone) float32 84kB 2.6e+06 2.6e+06 ... 2.606e+06 2.606e+06
    dx       (zone) float32 84kB 500.0 500.0 500.0 500.0 ... 100.0 100.0 100.0
    dy       (zone) float32 84kB 500.0 500.0 500.0 500.0 ... 100.0 100.0 100.0
    z        (zone) int64 168kB 2 2 6 6 8 8 8 8 5 2 6 ... 2 2 2 2 2 2 2 2 2 4 4
izone (zone) int32 84kB 345 331 2139 2111 ... 13132 13062 19985 19965# xarray version
toto = gm.assign_coords(surf, add_lay=False) # add lay false because it needs to be a variable to plot, not a dimension
gm.plot_outcrop(toto)
plt.show()
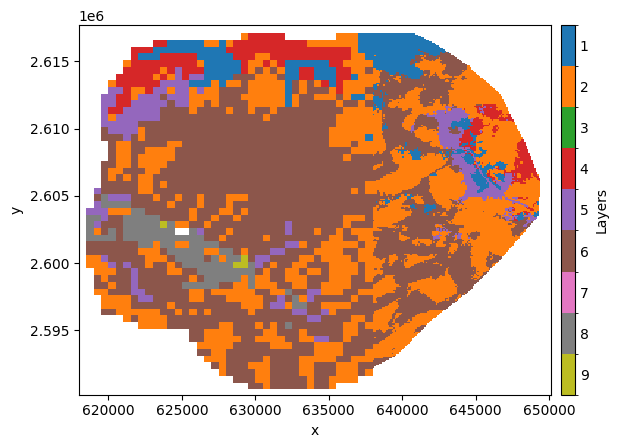
This function also allow user to get the value of a variable in the surface layer, or a subset of aquifer layers.
For example, to get the value of your variable (groundwater head for example) in the first layer encountered between 3 layers:
head_surf = gm.get_surface_layer(grid, aquif_layers=[6,8,9]) # get the values in the first layer between layers 6, 8 and 9
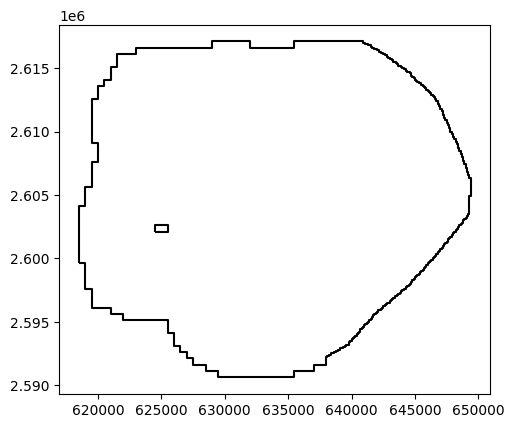
Get mask of active domain
mask = gm.get_active_mask(grid) # return a geopandas geodataframe
/home/docs/checkouts/readthedocs.org/user_builds/gridmarthe/envs/v0.3.0/lib/python3.10/site-packages/gridmarthe/operasem/gis.py:71: FutureWarning: The return type of `Dataset.dims` will be changed to return a set of dimension names in future, in order to be more consistent with `DataArray.dims`. To access a mapping from dimension names to lengths, please use `Dataset.sizes`.
  if 'time' in ds.dims.keys():
mask.boundary.plot(color='k')
plt.show()
Compute depths and thickness
Users can get geometry attributes (depth, thickness, upper/lower altitudes) in a dataset:
topo = gm.load_marthe_grid('./data/example.topog')   # be careful with nan here, topography can be set outside of active area
hsubs = gm.load_marthe_grid('./data/example.hsubs')  # same here, hsubs can be set outside of active area
geom = gm.compute_geometry(topo, hsubs)
# print(geom.where(~geom['depth'].isnull(), drop=True))
geom
<xarray.Dataset> Size: 80MB
Dimensions:    (time: 1, zone: 1176480)
Coordinates:
  * time       (time) datetime64[ns] 8B 1850-01-01
  * zone       (zone) int32 5MB 1 2 3 4 5 ... 1176477 1176478 1176479 1176480
Data variables:
    h_topogr   (time, zone) float64 9MB 9.999e+03 9.999e+03 ... 9.999e+03
    x          (zone) float32 5MB 5.438e+05 5.442e+05 ... 7.362e+05 7.368e+05
    y          (zone) float32 5MB 2.678e+06 2.678e+06 ... 2.526e+06 2.526e+06
    dx         (zone) float32 5MB 500.0 500.0 500.0 500.0 ... 500.0 500.0 500.0
    dy         (zone) float32 5MB 500.0 500.0 500.0 500.0 ... 500.0 500.0 500.0
    z          (zone) int64 9MB 1 1 1 1 1 1 1 1 1 ... 10 10 10 10 10 10 10 10 10
    z_lower    (time, zone) float64 9MB nan nan nan nan nan ... nan nan nan nan
    z_upper    (time, zone) float64 9MB nan nan nan nan nan ... nan nan nan nan
    thickness  (time, zone) float64 9MB nan nan nan nan nan ... nan nan nan nan
    depth      (time, zone) float64 9MB nan nan nan nan nan ... nan nan nan nan
Attributes: (12/17)
    conventions:          CF-1.10
    title:
    marthe_grid_version:  9.0
    original_dimensions:  x,y,z [grids]: 387 304 10
    crs:                  {'crs_wkt': 'PROJCRS["NTF (Paris) / Lambert zone II...
    lon_resolution:       500.0
    ...                   ...
    period:               1850-1850
    frequency:            nan day(s)
    creation_date:        Created on 2025-12-09T16:24:01Z UTC
    comment:              Hydrogeological model created with MARTHE code (Thi...
    domain:               FR-France
institution: BRGM, French Geological Survey, Orléans, FranceInterpolation, regridding, transformations
Regrid (coarse/refine resolution)
# Tutorial in construction