Use computed velocity field
MARTHE can compute groundwater flow velocity field. The output file is write as a column separated text file and not as a Marthe grid file. Therefore, a specific function is provided to read such output.
# load package and read data
import gridmarthe as gm
ds = gm.read_velocity('data/veloci.out')
The read data store different velocity variables: vx (velocity along x dimension),
vy, vz, vmod (the velocity module), etc.
print(ds)
<xarray.Dataset> Size: 89kB
Dimensions:  (istep: 1, zone: 927)
Coordinates:
  * istep    (istep) int64 8B 6210
    time     (istep) float64 8B 6.422e+03
  * zone     (zone) int64 7kB 1 2 3 4 5 6 7 8 ... 921 922 923 924 925 926 927
Data variables:
    vx       (istep, zone) float64 7kB 0.0 0.0 0.0 ... 8.64e-07 -4.219e-07
    vy       (istep, zone) float64 7kB 0.0 -1.945e-06 ... -1.552e-06 -3.589e-07
    vz       (istep, zone) float64 7kB 0.0 0.0 0.0 0.0 0.0 ... 0.0 0.0 0.0 0.0
    vmod     (istep, zone) float64 7kB 0.0 1.945e-06 ... 1.776e-06 5.539e-07
    x        (zone) float64 7kB 617.8 618.2 618.8 619.2 ... 606.8 607.2 607.8
    y        (zone) float64 7kB 2.567e+03 2.567e+03 ... 2.543e+03 2.543e+03
    z        (zone) float64 7kB 115.6 114.8 111.1 110.4 ... 11.57 11.4 10.8 11.0
    igrid    (zone) int64 7kB 0 0 0 0 0 0 0 0 0 0 0 0 ... 0 0 0 0 0 0 0 0 0 0 0
    lay      (zone) int64 7kB 1 1 1 1 1 1 1 1 1 1 1 1 ... 1 1 1 1 1 1 1 1 1 1 1
    row      (zone) int64 7kB 5 5 5 5 5 5 5 6 6 6 ... 51 51 51 51 52 52 52 52 52
    col      (zone) int64 7kB 43 44 45 46 47 48 49 43 ... 23 24 19 20 21 22 23
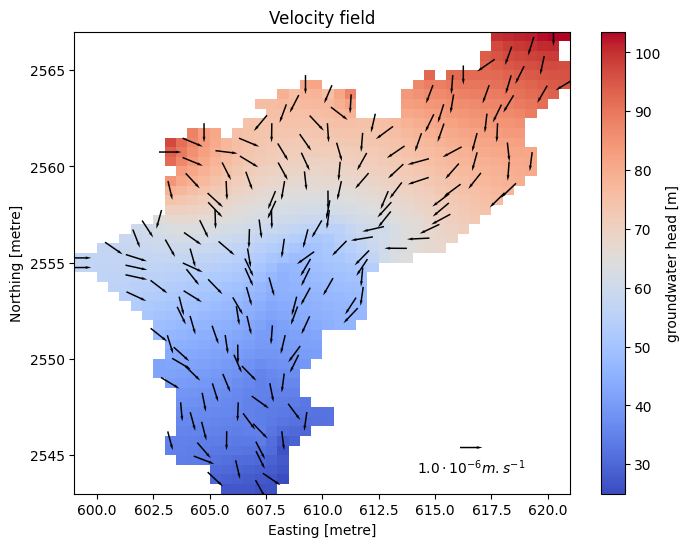
A specific function can be used to plot the velocity field with matplotlib quiver plot. The velocity is normed for visualisation convenience.
import matplotlib.pyplot as plt

# read groundwater head for visualisation
headsim = gm.load_marthe_grid('data/chasim_hallue.out', fpastp='./data/hallue.pastp', drop_nan=True)
headsim2d = gm.assign_coords(headsim.isel(time=-1))

# plot it with velocity field
fig, ax = plt.subplots(figsize=(8, 6))
headsim2d['charge'].plot(ax=ax, cmap='coolwarm')
gm.plot_veloc_quiver(ds, ax=ax, xyfreq=5, loc_scale_xy=(0.8,0.1))
plt.show()
/home/docs/checkouts/readthedocs.org/user_builds/gridmarthe/envs/v0.4.0/lib/python3.12/site-packages/gridmarthe/plot/plotting.py:370: RuntimeWarning: invalid value encountered in divide
  vx_norm = vx / norm
/home/docs/checkouts/readthedocs.org/user_builds/gridmarthe/envs/v0.4.0/lib/python3.12/site-packages/gridmarthe/plot/plotting.py:371: RuntimeWarning: invalid value encountered in divide
  vy_norm = vy / norm